Continuing my exploration of the music currently being programmed by leading orchestras, I’m going to focus next on the Philadelphia Orchestra.
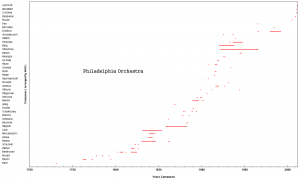
Again you can see the clusters around the very recent, and especially around the 1915-1940 area. Here’s the condensed coverage map:
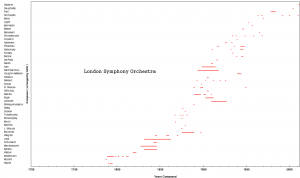
Doing better in the 1980’s here, but the 70’s are still missing. I should note here another potential pitfall of this graphic. The compositions are marked by the entire known period that they were composed. I did this for several reasons, but primarily to account for changes in style between conception and completion, as well as revisions and orchestrations. I found that overall this has little impact on the resulting image, as most pieces are completed fairly rapidly, and the composer’s lifetime serves as an absolute limit.
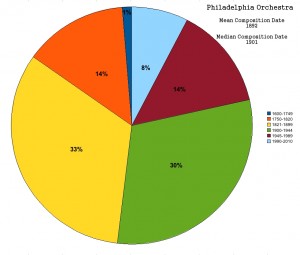
The results after binning are both different and similar to those seen with the CSO. Romantic and Modern (yellow and green) still make up roughly a third each of the compositions, though Romantic is 6% more here than before. This is paid for with the Classic and Baroque periods, which are slightly lessened. Contemporary (red) is the same, but the last twenty years of music make up only 8% compared to 10% in the other. Also of note is the slight rise in the average date of composition, from 1884 to 1892. The median has also risen to 1901 up from 1895. The median is something that I think can help explain for my surface observations when looking at an orchestra’s season lineup.
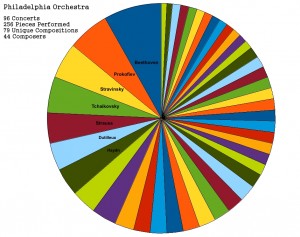
These charts don’t account for the total number of performances like the next ones, rather, they are based on the individual (unique) compositions. Here are the charts showing the breakdown of composers:
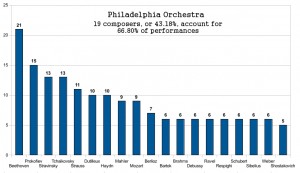
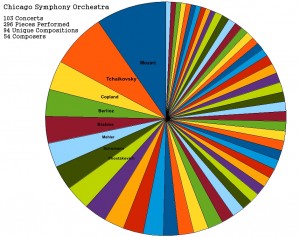
Mozart is gone, and Beethoven has taken his place with 8.20%. Prokofiev is next with 5.86%, but I think you’ll agree that the overall distribution seems a little smoother than with the CSO. Every orchestra, it would seem, has their favorites. I’m ok with that. Beethoven is still a little skewed here though if you ask me. Comparing the other stats, the CSO and PO have roughly the same number of “regular” orchestra concerts, and the PO’s 7 concert deficit can potentially explain the 15 fewer compositions and 10 fewer composers represented. Tchaikovsky is still there, but Prokofiev and Stravinsky and even Dutilleux are prominently positioned (Henri Dutilleux is the Philadelphia Orchestras “Featured Composer” this season).
I realize it can be difficult to compare the bar charts when the percentage of composers represented is different. Going through the data, it was always apparent where the majority began, usually after 5. After that the number of pieces would go from a handful to a torrent, so I placed a different cutoff for each orchestra as best as I could. With the Philadelphia Orchestra, 2/5 of composers account for over 3/5 of the music. Still, this seems much more fair than with Chicago.
Having investigated two of the “Big Five”, I decided I needed to look at an orchestra outside the United States, but still firmly western/Anglo-Saxon. The London Symphony Orchestra is at the level of being a brand name at this point, and so they seemed like a good place to look. This orchestra does fewer public performances at home and instead does substantially more recording and touring. Still, I believe they are a useful barometer of performed music, given their popularity.
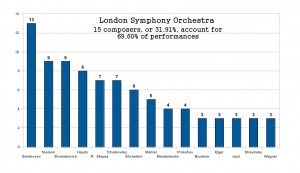
Beethoven is back, with 10.40% of the performed pieces. Nielsen might seem like a surprising 2nd place candidate, but the answer lies in the existence of “Sir Colin Davis’s Beethoven/Nielsen series with Mitsuko Uchida [pianist]”. In total there are 8 concerts each programmed with a Haydn symphony, a Nielsen symphony, and a Beethoven piano concerto. I’m not saying orchestras should avoid such special series, and indeed these only account for 17% of the LSO’s season. Even with the repetition of composers, there are few repeated pieces. 1.238:1 pieces to composers is a pretty good ratio actually. There are more holes in their coverage map, but I’d say it’s because there are fewer pieces of music in their season.
The possibly unfamiliar name of Rodion Shchedrin also appears on this chart. I’ve been seeing him programmed more and more lately. The LSO in playing a larger number of his pieces than might be considered usual thanks to a lineage that connects Shostakovich to Shchedrin, and Shedrin to his friend, conductor Valery Gergiev. I believe this has boosted Shostakovich here as well. Richard Strauss is just one of those favorites particular to each orchestra/conductor/creative director, I think.
Beethoven again sets up a bit of a gap, but the rest of the top composers show a fairly smooth distribution. After this, there are 6 composers with 2 pieces, and the remainder have one. Once again I am disappointed to see that 1/3 of the composers account for so many pieces. Perhaps the classical world just can’t latch onto the idea of a “single” or “one hit wonder”. Of course there are some of those: Dukas, who burned most of his works, is almost always heard via The Sorcerer’s Apprentice and his Symphony in C. Similarly, Mussorgsky is almost always heard through Night on Bald Mountain and Pictures at an Exhibition. It’s too bad, really, because these two wrote so many other wonderful compositions. But now lets look at my favorite chart, the distribution of compositions by period.
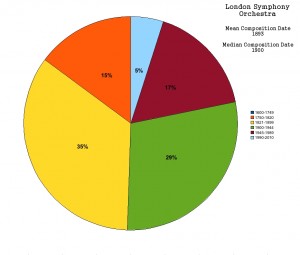
Ack! The first question one may have is, “Where is Baroque?” Not featured. Perhaps the existence of so many other ensembles in the UK specializing in Baroque music means a modern symphony does not need to try and squeeze it into their season. This is actually a really great thing, maybe. The modern orchestra just isn’t set up for Baroque music, and the challenges of performing that period correctly are beyond the training of many musicians. Leave it to the passionate players who focus specifically on that period. Maybe.
The last 20 years of music have come up short here. Less Classic than CSO, but also more Modern than both the CSO or PO. At least half of the music was written in the last 110 years, but the median date is only 1900 here. At least with their mini-series and featured composers they help spread the word about new music. Many people greatly enjoy being able to communicate with the composers before and after (and less often during) a performance. It makes the performance less a case of “the orchestra as a museum” and more of an active contribution to the culture that is flourishing all around us. Many orchestras wear it like a badge in their marketing material: “The Philadelphia Orchestra proudly presents the works of 12 living composers in the 2010-11 season.” Although I’m sure these orchestras would rather have zombie Beethoven and zombie Mozart if they could.
So we’ve looked at the Chicago Symphony Orchestra, Philadelphia Orchestra, and now the London Symphony Orchestra. I realized very early in the data mining process that I would not be able to run too many orchestras through the machine with the amount of time I have available, but I knew that I wanted to look at at least one smaller orchestra. In the next section I’ll look at one of the best-in-class, the Oregon Symphony, and attempt to draw some meaningful conclusions about the overall state of performed orchestral music.
You can continue on to Part 3: The Oregon Symphony, My Conclusions, and Notes Or, go back and read Part 1: A Brief Introduction, and the Chicago Symphony Orchestra
